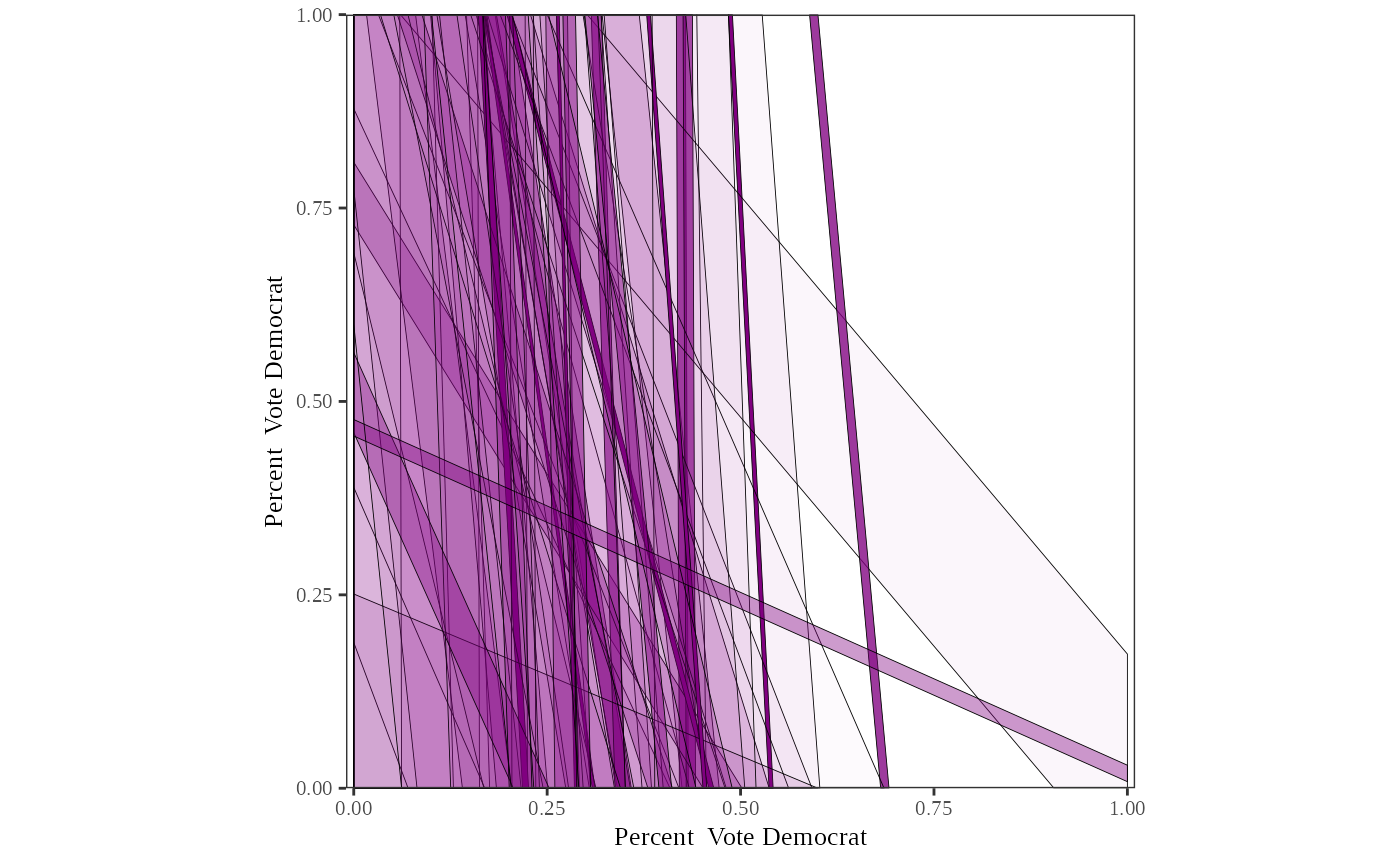
Visualizing EI (bound)
Usage
plot_bound(ei.object, options = list())Arguments
- ei.object
The output of
ei()(it should be used with thetruthargument)- options
The list of options
parameter: A parameter to plot. It takes either
betaborbetaw. This option is only for the 2x2 case.
Examples
# 2x2
data(matproii)
truth <- cbind(matproii$tb, matproii$tw)
suppressMessages({
ei_res <- ei(formula = t ~ x, total = "n", truth = truth, data = matproii)
})
plot_bound(ei_res, options = list(parameter = "betab"))
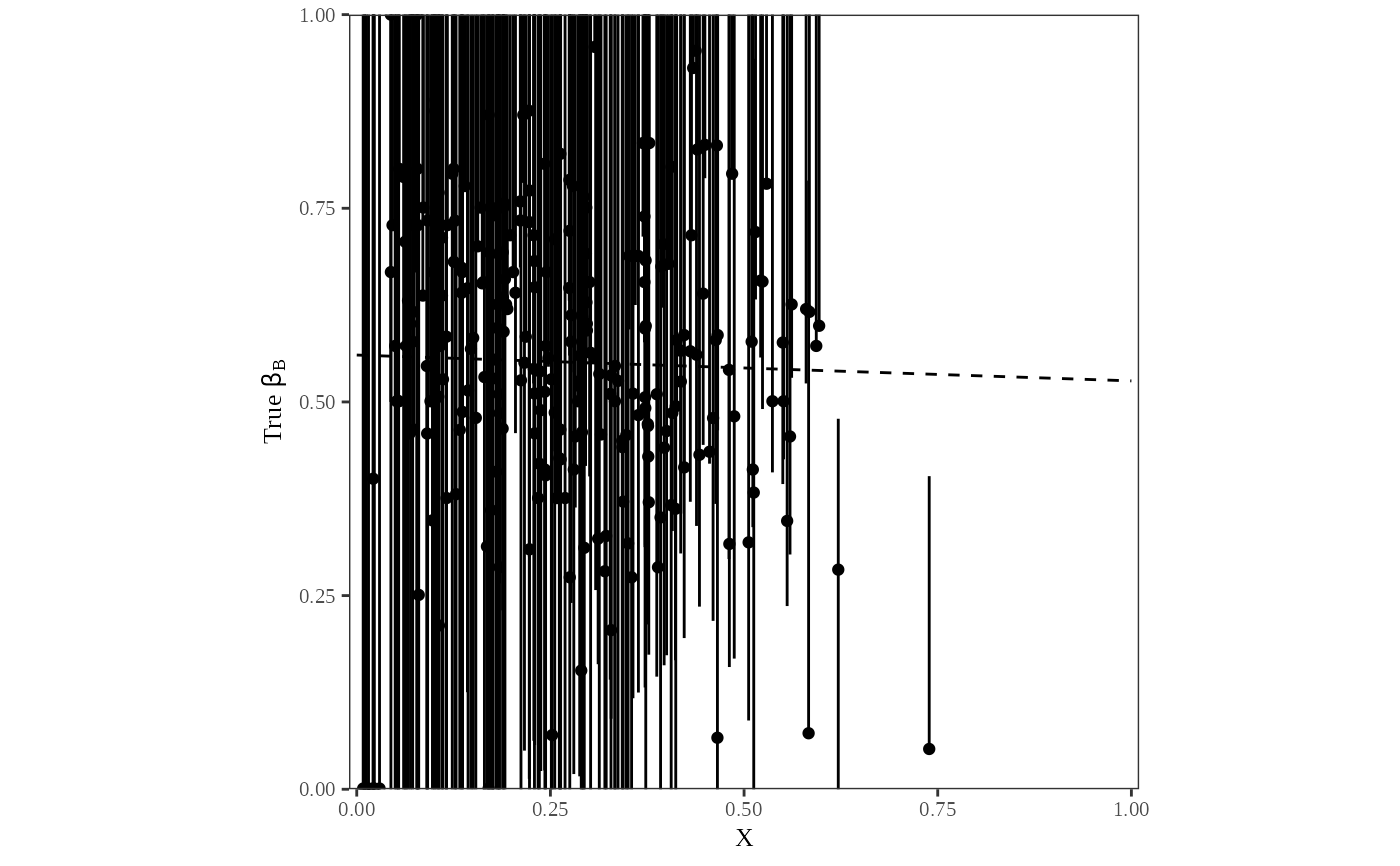 plot_bound(ei_res, options = list(parameter = "betaw"))
 # RxC
data(RxCdata)
formula <- cbind(turnout, noturnout) ~ cbind(white, black, hisp)
suppressMessages({
ei_resRxC <- ei(formula, data = RxCdata)
})
plot_bound(ei_resRxC)
# RxC
data(RxCdata)
formula <- cbind(turnout, noturnout) ~ cbind(white, black, hisp)
suppressMessages({
ei_resRxC <- ei(formula, data = RxCdata)
})
plot_bound(ei_resRxC)